See what needs your attention right away.
Presence, status, and response time for every service. The right amount of information, without the noise.
NasDash is the self-hosted dashboard that keeps Docker, your servers, and your homelab services within reach.
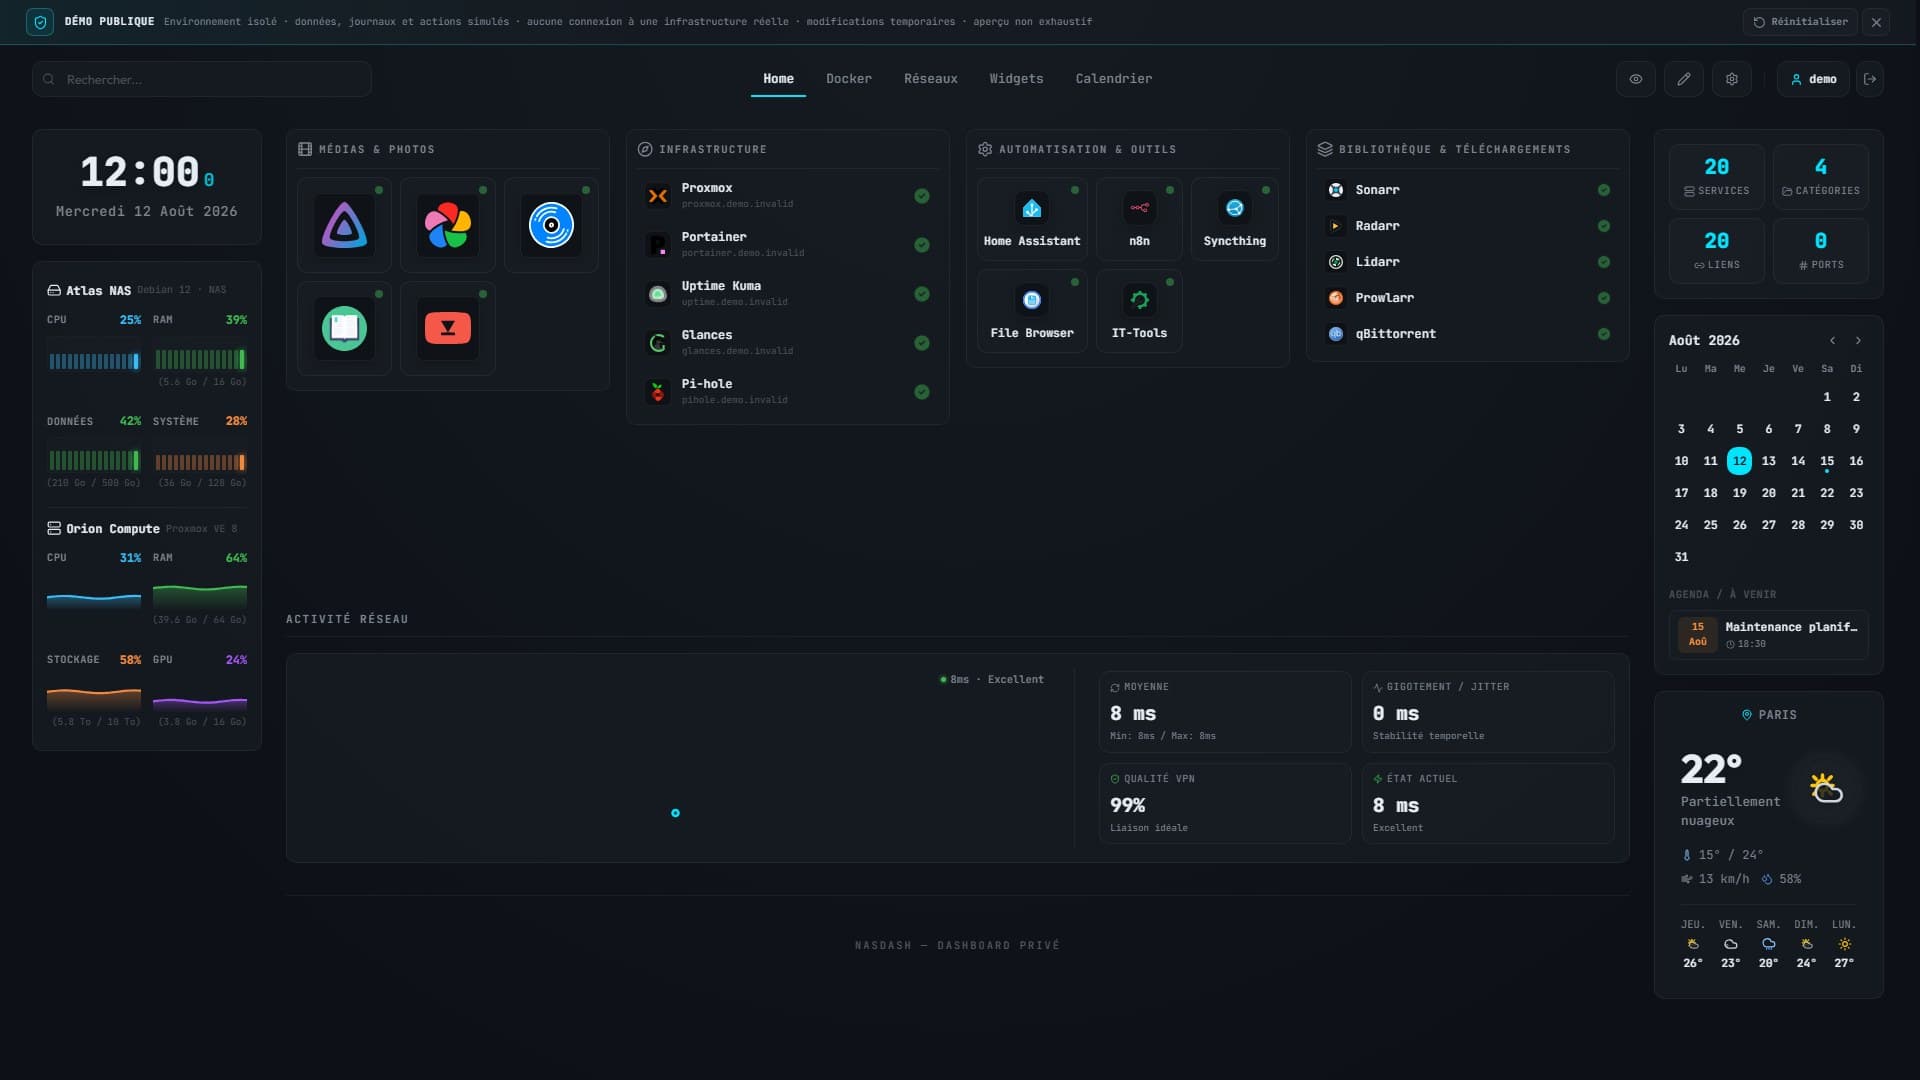
NasDash gives you a clear reading of your homelab: services, machines, networks and essential actions in one calm workspace.
Presence, status, and response time for every service. The right amount of information, without the noise.
CPU, memory, storage and sensors for your servers, VMs, and containers are always close at hand.
Arrange your spaces with the widgets you use every day: network, Docker, calendar, and more.
Explore widgetsClean on the surface, thoughtful where it matters: reliability, performance, and control.
CPU, memory, storage, networking, and availability in a view that stays readable as your infrastructure grows.
Monitor your containers and trigger the essential actions without switching between interfaces.
Build tabs with modular widgets: services, weather, stats, shortcuts, and more.
Bring your Tailscale machines, links, and services into the place where you work.
Pings and telemetry are designed to remain responsive, precise, and pleasant to read.
Self-hosted, open source, and built around good practices so you keep control of your data.
Choose the launch method that fits your environment.
services:
  nasdash:
    image: ghcr.io/lucas-lepajollec/nasdash:latest
    ports:
      - "2504:2504"
    env_file:
      - path: .env
        required: false
    volumes:
      - ./data:/app/data
    pid: host
    depends_on:
      - docker-proxy
    extra_hosts:
      - "host.docker.internal:host-gateway"
    restart: unless-stopped

  docker-proxy:
    image: tecnativa/docker-socket-proxy:v0.5.0
    volumes:
      - /var/run/docker.sock:/var/run/docker.sock:ro
    environment:
      CONTAINERS: 1
      IMAGES: 1
      VOLUMES: 1
      NETWORKS: 1
      INFO: 1
      POST: 1
      DELETE: 0
    restart: unless-stopped